TSSG is a business coaching based in Connecticut that works specifically with generator dealers. Founded in 2023, the company now works with over 75 generator dealerships across the nation, providing them with modern digital solutions to support the sales process.
I’ve been working at TSSG since December 2023 to manage and create content for their social media channels. Needless to say, I’ve learned a lot along the way: what works what definitely doesn’t work, and everything in-between.
This week, I evaluated TSSG’s current performance on our two best performing platforms, Facebook and LinkedIn. Although we also have a presence on Instagram, YouTube, and TikTok, a majority of our audience and client base are mainly found on these two social networks.
Organic Performance
Using Sprout Social, I analyzed the company’s performance over January 2025 (more specifically, a 28-day range between January 3-30).
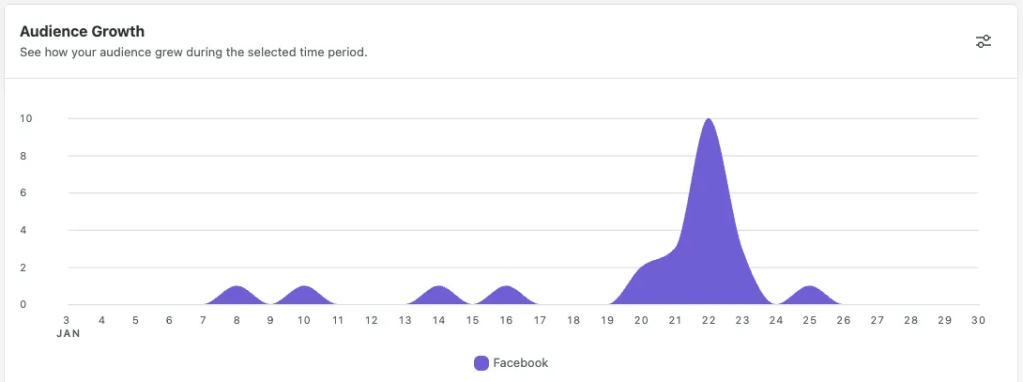
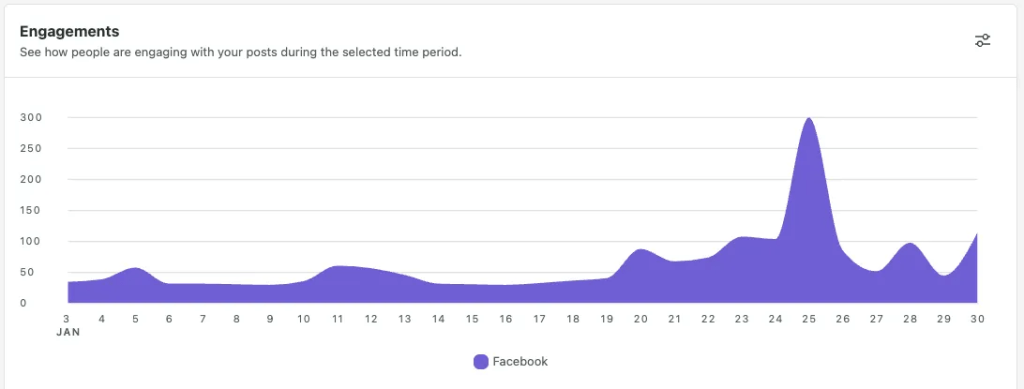
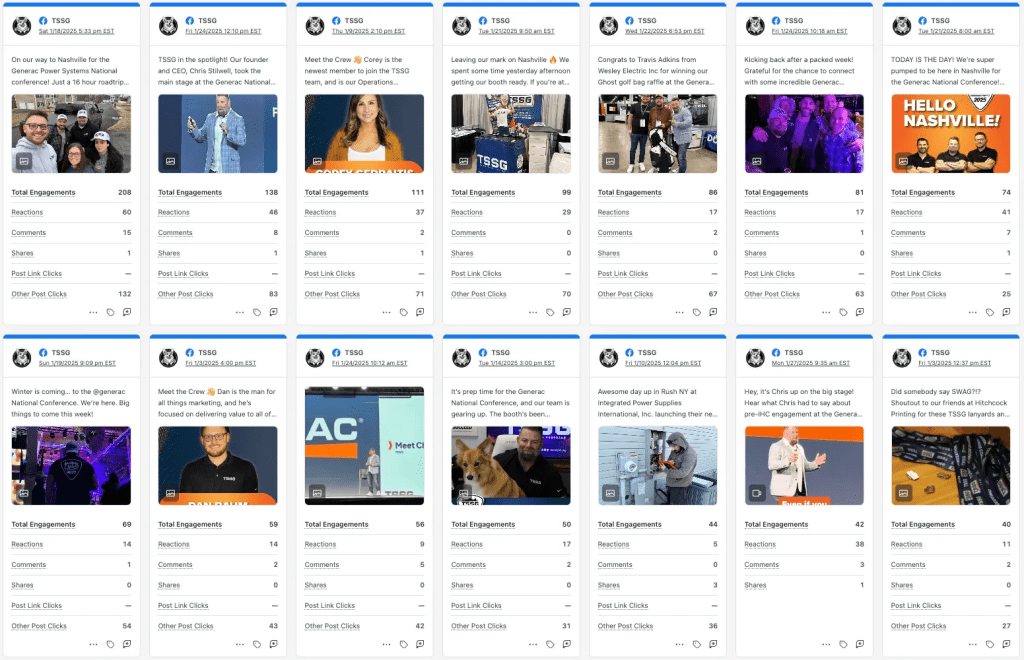
On Facebook, TSSG collected 21,200 impressions and 1,770 engagements, with an 8.4% engagement rate per impression. There is a noticeable spike in audience growth on January 22nd. This can be explained by the fact that the company was a featured vendor at a national generator conference, where the owner spoke at on of the main sessions. This conference took place from the 21st to the 23rd, explaining the sudden rise in audience growth during these days as compared to the rest of the month. Similarly, there is a spike in engagement in the days after the conference.
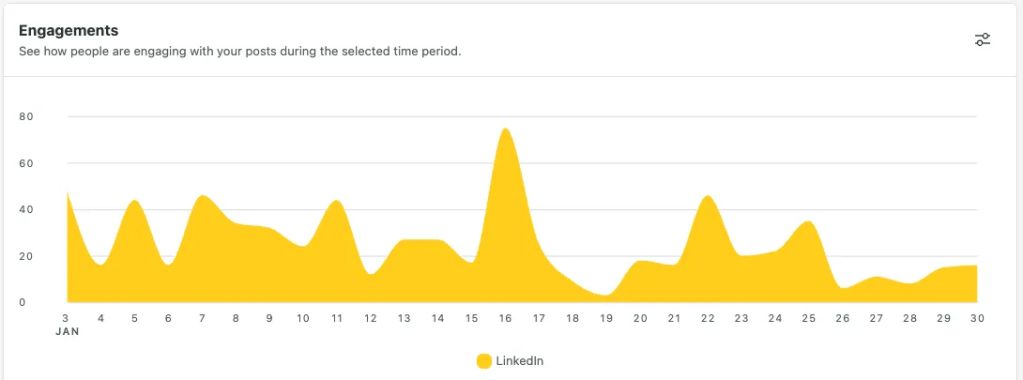
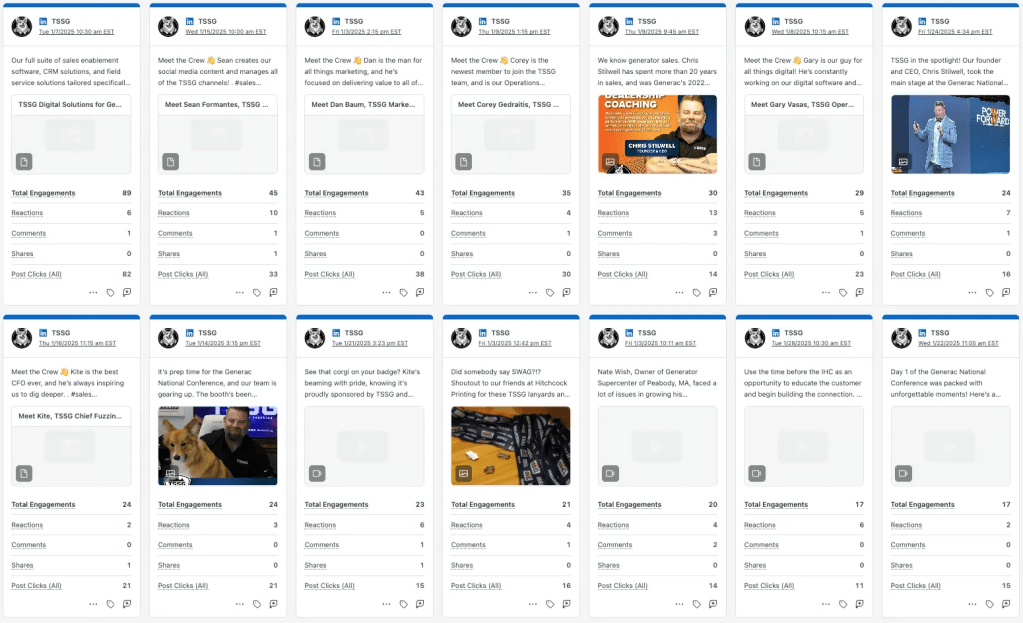
On LinkedIn, the brand garnered 3,424 impressions and 712 engagements. Although this is significantly lower than the Facebook stats, the engagement rate sits at 20.8%. However it is important to account for the fact that there is a large audience/follower base on Facebook, so a higher engagement rate would make sense for the LinkedIn channel.
Unlike Facebook, there is no noticeable or major increase in audience growth around the time of the conference. However, there is interestingly a spike in engagement in the days leading up to the conference.
When it comes to post performance, photos and graphics receive higher engagement as compared to short-form video content. This comes as a surprise, considering that a lot of time is spent at the office making short-form video content of sales and marketing tips. Instead, pictures of the crew out and about, as well as staff features, make up the bulk of engagement on Facebook.
On LinkedIn, engagements per post are noticeably lower than Facebook, faring in the double digits instead of triple. Still, the engagement on the short-form videos are noticeably lower compared to other posts.
Platform Analytics
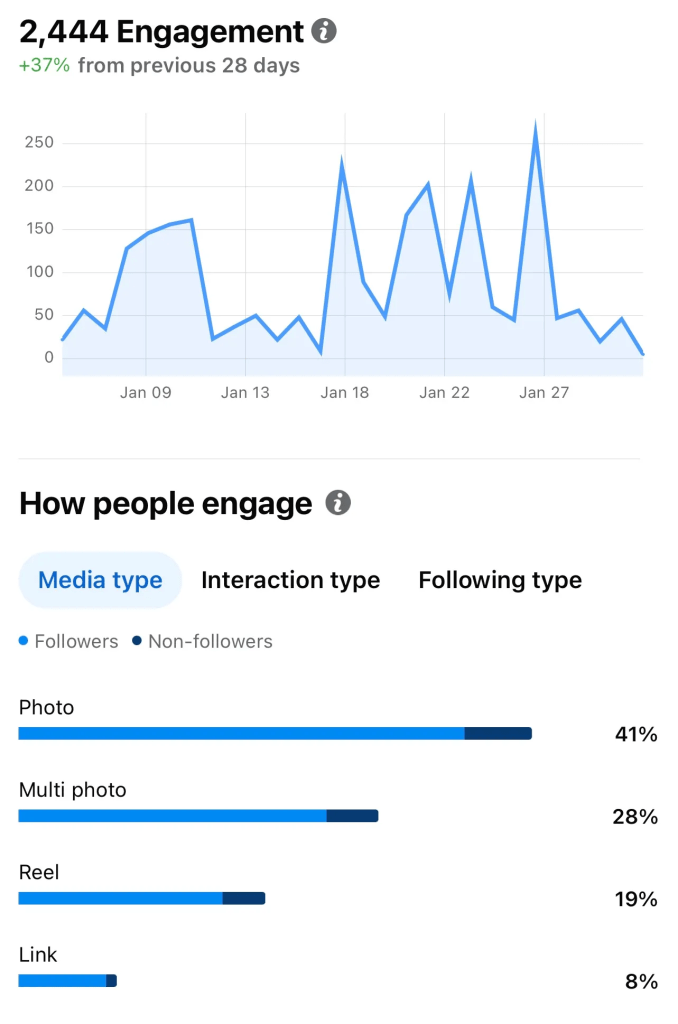
In reviewing the Facebook insights, it becomes even more apparent and carousels receive more engagement on the platform for over the short form reels. While photos make up for 41% engagement and multi-photo carousels for 28%, reels only make up for 19% with links at 8%. Considering that much of the current strategy is focused on short-form videos, it should be revisited to incorporate more photos, as this content type seems to resonate more with the audience.
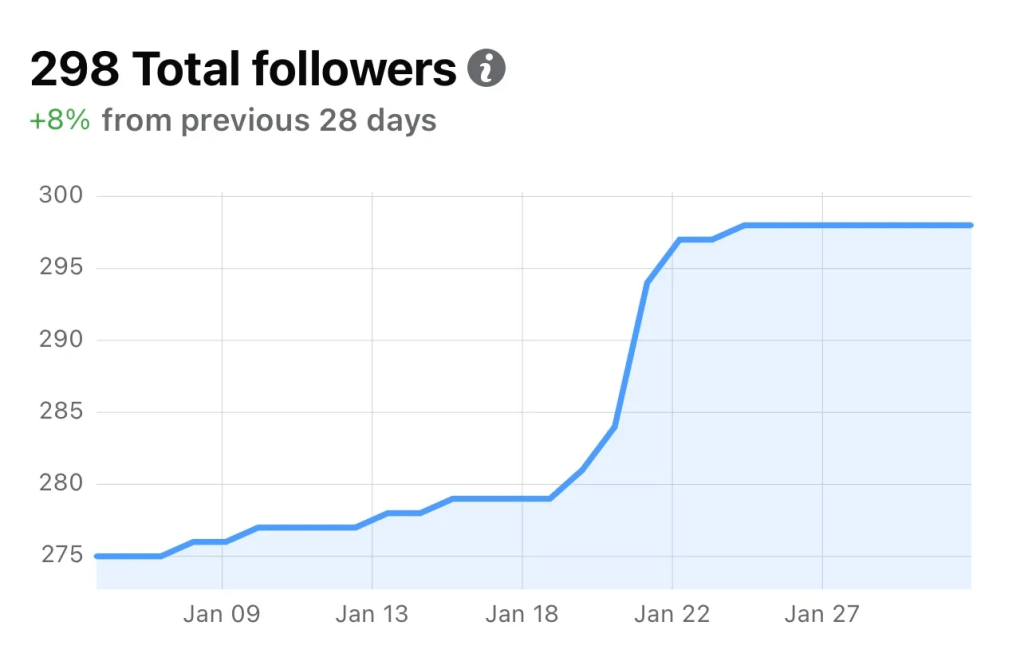
The insights also confirm a rise in followers after the conference, with a spike occurring around the 21st.
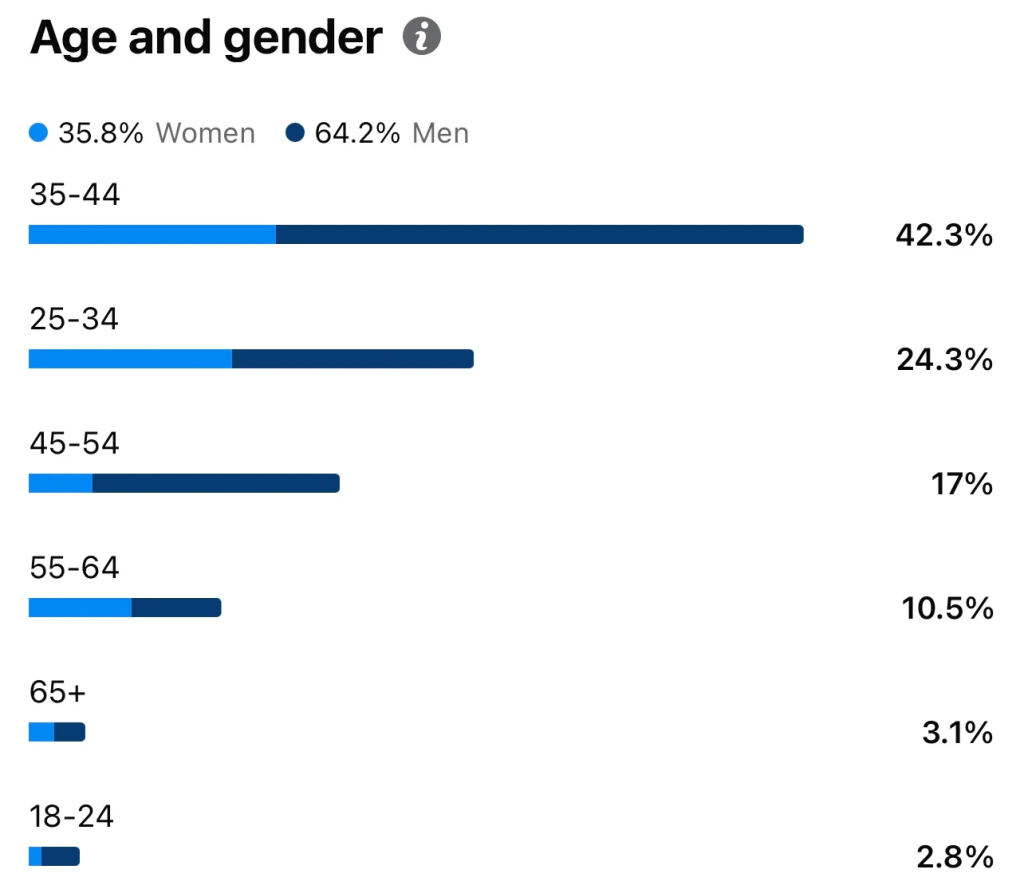
When it comes to audience demographics, 35-44 year olds make up 42.3% of the audience, followed by 25-34 year olds at 24.3%. There is a male majority in all age groups.
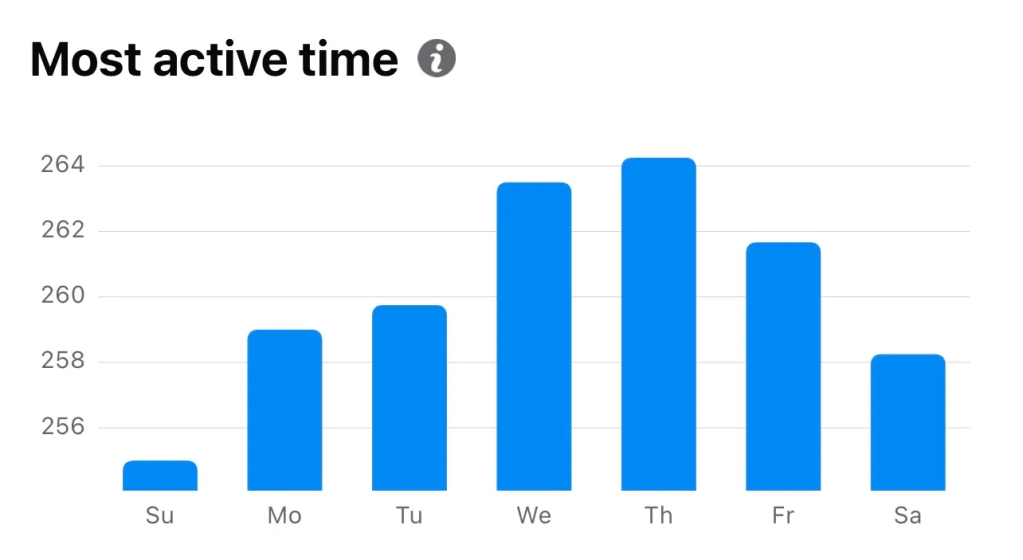
According the Facebook, our audience is the most active on Thursday, followed by Wednesday and Friday, respectively.
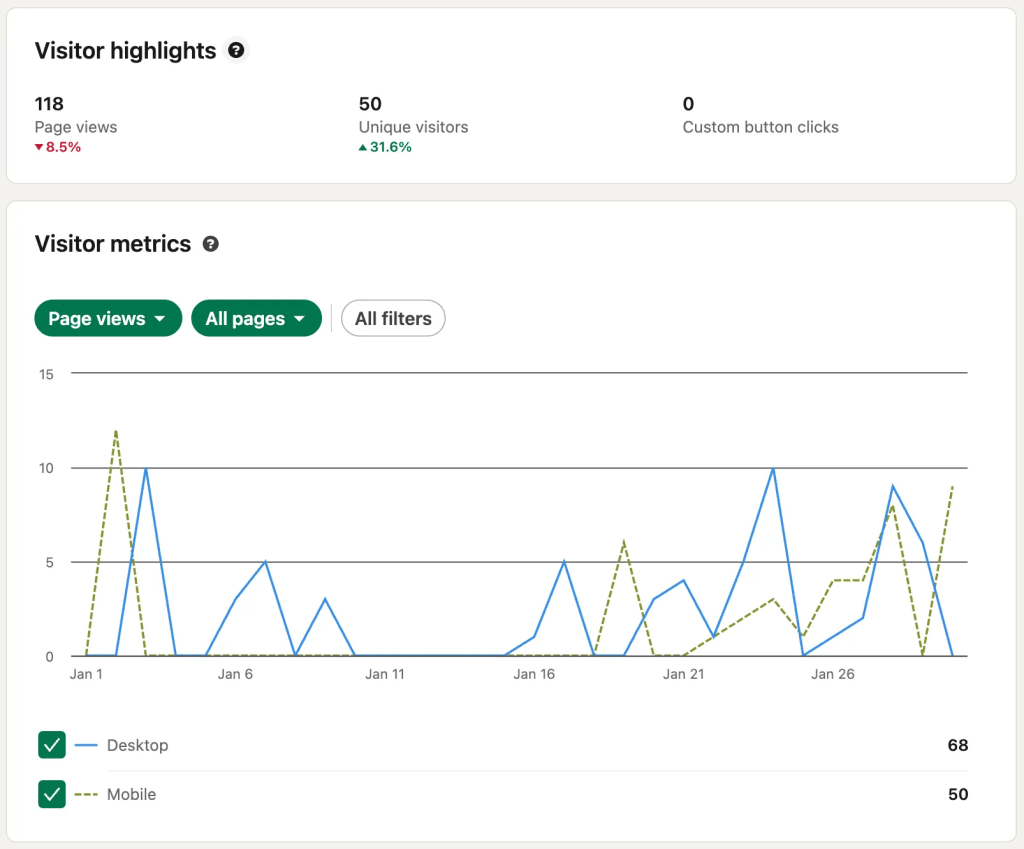
LinkedIn provides more professional information about the audience as compared to Facebook, which makes sense considering the platform. Insights show that within the 28 day time frame, there were 118 page views, with a majority of these coming from desktop as compared to mobile.
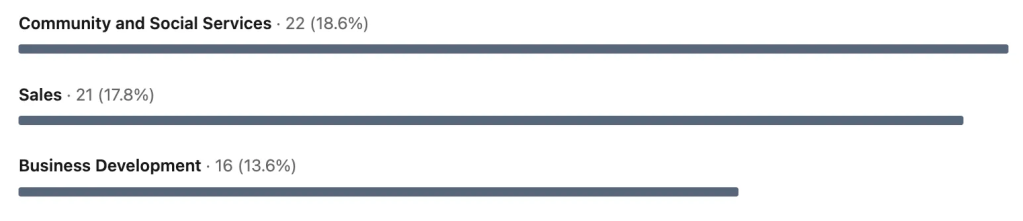
The top three industries of the audience are community and social services, followed by sales and business development. This insight is interesting, given that we are predominantly a sales and business development company, not social services.
Proposed Strategy
Based on the outline in The Marketing Campaign Playbook by Sharon Lee Thony, I created the following organic social strategy based on the findings from the insights.
Objective
The main objectives for our social media strategy are to engage the current client community and increase new client leads/conversions. Since we have a solid following from current dealers who are very happy with out business, our social media strategy should aim to increase their engagement in order to build the brand and generate more interest in the brand.
Based on a objective and tactic outline shared in Chapter 2 of Social Media ROI by Olivier Blanchard, here are our two objectives with the associated tactic:
Objective 1: Engage the current client community.
Tactic: Increase the engagement rate across social media posts.
Objective 2: Increase conversions.
Tactic: Share educational information about our company’s offerings.
Audience Analysis
Tools: Sprout Social, Meta Business Suite, LinkedIn Insights
Findings: Our audience consists mostly of Generation X and millennials in the generator sales industry, as based on the insights shown by LinkedIn and Facebook.
Content Themes and Topics
Theme 1: Building The Business
Topic: “On The Road”
Format: Pictures and selfies of travels and seminars with dealers, telling the story of how our business has grown dramatically.
Justification: Photos from recent travels to dealers and to the national conference performed the most successfully in terms of engagement, as compared to other types of content.
Theme 2: Team Member Personalities
Topic: Hot Takes
Format: Team members share their opinions and tips on navigating the sales/marketing industry – or just random things. This allows our content to tap into the “emotion connection” highlighted in Paid Attention by Faris Yakob.
Justification: The team member intros performed well, with high engagement. Showcasing our team members more often will inject a personality to our brand, which will resonate with our audience.
Theme 3: About The Business
Topic: What We Do To __________
Format: Carousels/infographics explaining business offerings to solve various sales/management problems, with a CTA included at the end.
Justification: Educating current/potential customers on our company’s offerings to generate conversions.
Content Formats/Channels
Frequency: Consistent posting at least one post a day minimum across all social channels, repurposing content to be platform specific.
Content Types: Travel Pictures, Business Building, BTS, Testimonials, Sales Tips, Polls/Questions/Quizzes, and Dog Videos
Tools: Adobe Create Cloud, Adobe Express, Canva, Buffer, Notion (Content Calendar)
Engagement and Optimization
Engagement: Respond to all direct messages and comments in a timely manner. Individuals looking to work with us are likely to initiate conversation through direct messaging, if not through the website.
Optimization: Success of this strategy is based on an increase in engagement rates.
Results
The main goal would be to increase Facebook and LinkedIn engagement rate by 5%, predominantly through shares/reposts and comments.
References
Blanchard, O. (2011). Social Media ROI. Pearson Education.
Faris Yakob. (2015). Paid Attention. Kogan Page Publishers.
Thony, S. L. (2024). The Marketing Campaign Playbook. STK MKT Entertainment.

Leave a comment