
On is an athletic brand which has recently been growing in popularity. Originally founded in 2010, the Switzerland-based company was called the “Fastest Growing Athletic Shoe Brand in [the] U.S.” by Forbes in 2021. It is known for its innovative “CloudTec” technology and partnerships with noteworthy figures such as tennis champion Roger Federer and actress Zendaya.
This week, I practiced my skills in analyzing key performance metrics by analyzing On’s metrics across their social media accounts. As a younger company compared to its competitors, it is integral that On makes informed decisions around their marketing. As Sharon Lee Thony writes in The Marketing Campaign Playbook, “Marketers now have access to vast amounts of data that allow them to make informed decisions about their campaigns.” I’ve looked into some of On’s publicly available stats, and did some math myself to see where their social metrics currently stand.
Metrics

Engagement Rate: According to an article by Chloe West for HubSpot, to calculate a brand’s engagement rate, you take the total interactions and divide that by the number of followers, and multiply that by 100. Since the information for On’s engagement rate was not available publicly, I performed some of my own calculations based on the available data for followers, likes, comments, and shares.
- Facebook: 2.61%
- Instagram: 20.47%
- LinkedIn: 40.03%
- TikTok: 3.92%
- Twitter: 16.98%
- YouTube: 63.47%
Followers: Each channel’s follower count, as displayed on the platform.
- Facebook: 853k / 806k
- Instagram: 2.4m
- LinkedIn: 356k
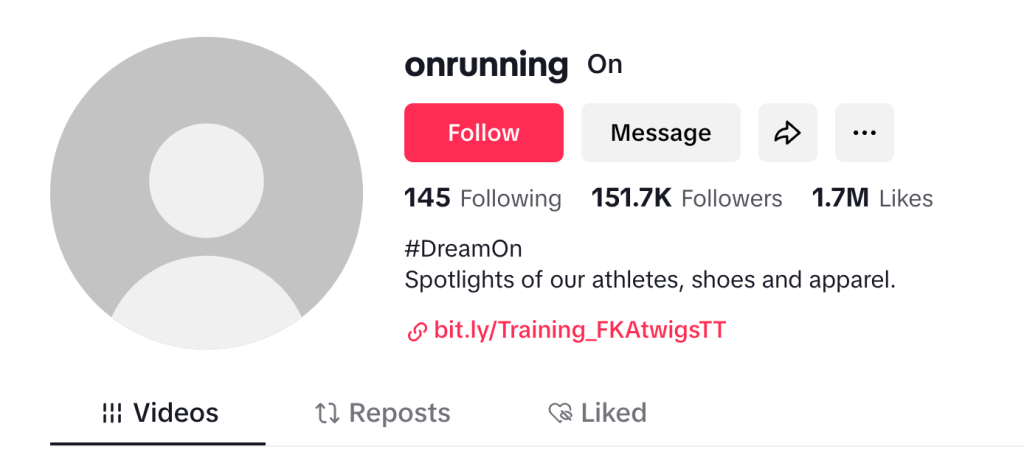
- TikTok: 151.7k
- Twitter: 95.1k
- YouTube: 62.8k
Likes: Taken as an average of the 10 most recent posts, with the exception of over-performing posts.
- Facebook: 192
- Instagram: 4,872
- LinkedIn: 1,375
- TikTok: 58
- Twitter: 142
- YouTube: 386
Comments: Taken as an average of the 10 most recent posts, with the exception of over-performing posts.
- Facebook: 22.9
- Instagram: 41.2
- LinkedIn: 15.2
- TikTok: 1.5
- Twitter: 2.9
- YouTube: 12.6
Shares: Each channel’s share count, as displayed on the platform. Data is not publicly available for Instagram, TikTok, and YouTube. However, it is possible for users to share content within Instagram and TikTok (and off the YouTube platform). This should be taken into account when reviewing the engagement rates for Instagram and TikTok, as the metric is most certainly higher than what can be calculated with available data.
- Facebook: 8.4
- Instagram: Unavailable
- LinkedIn: 34.7
- TikTok: Unavailable
- Twitter: 16.6
- YouTube: Unavailable
Views (Video): Taken as an average of the 10 most recent posts, with the exceptions of over-performing posts, and the Facebook calculation (which only used the three most recent videos due to a large time gap).
- Facebook: 56.6k
- Instagram: 275.4k
- LinkedIn: Unavailable
- TikTok: 2.9k
- Twitter: Unavailable
- YouTube: 61.9k
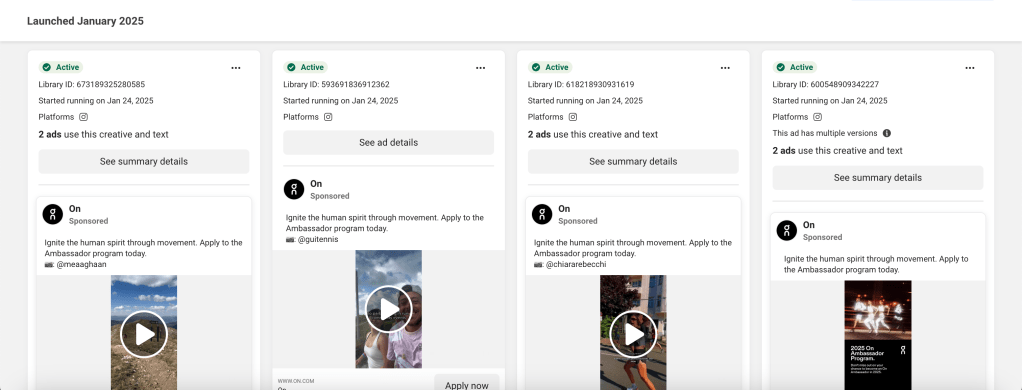
Paid Social
On’s paid efforts focus on highlighting their products, and driving users to purchase them through their own website. The ads are currently running globally in different languages. While the brand’s paid efforts are product-based, its organic posts feature more influencer-based content, including videos of athletes wearing On apparel.

Notably, On’s most recent paid campaign features influencer-generated content promoting the On ambassador program, with the link going to a sign-up page for the program.
Given that the bland is balancing between their organic and paid content, there is a clear strategy in-place that is aligned with the company’s goals. The system thereby meets Oliver Blanchard’s description in Social Media ROI, in which “A fully deployed social media program… amplifies the impact of very function within an organization by leveraging the power of human networks…” On involves a clear system of influencers (brand ambassadors), along with marketers, creatives, and social media experts behind their digital presence.
Analysis
Instagram is On’s most successful channel, having the highest metrics across all categories (with the exception of engagement, where LinkedIn performs better). Their second most successful channel is LinkedIn, although the account focus solely on work life posts.

Surprisingly, On underperforms in Facebook (with a 1.12% engagement rate despite having 853k followers) and TikTok (which only sees an average of 2.9k views and only 1.5 comments per post). On’s YouTube blows TikTok out of the water when it comes to video metrics.
As a fairly recent brand to rise in popularity, I’m led to believe that On is prioritizing its follower count over other metrics. The brand is competing against more established names, such as Nike and Adidas. On’s competitors have strong followings, and the company is positioned as the underdog. It would make sense for On to focus on increasing their follower count in order to build awareness of the brand online. It is also worthwhile to note that the engagement rates, as well as like and comment counts, pale in comparison to the follower counts. Although On has a stable large following, they don’t receive a lot of interactions on their posts.
Recommendations
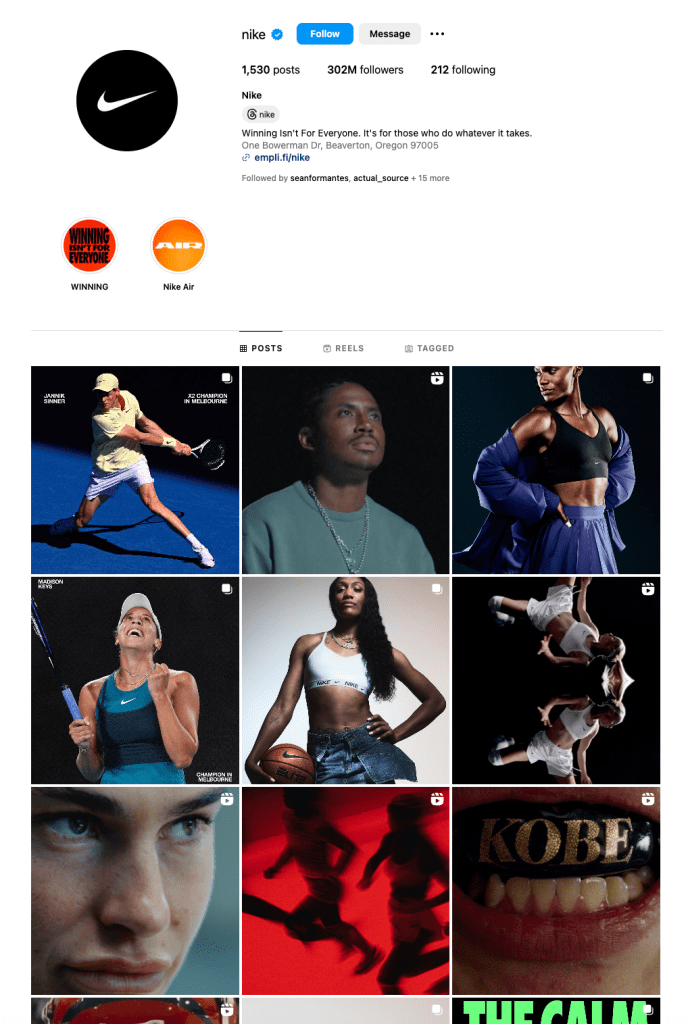
At a glance, On’s accounts are very similar to that of their larger competitors, such as Nike, Adidas, and Under Armour. They all have editorial-style photos and videos; being high produced and well-edited. Although all of these brands are well established and have great (and successful) social media strategies, this can make it harder for On to break through and differentiate themselves. Instead, On blends right into the mix.
The use of having an X/Twitter account stood out to me as being questionable. However, the brand surprisingly has a 16% engagement rate on the platform, which is better than that of their other channels. On should continue growing out an X/Twitter strategy, but should reconsider their use of the platform if engagement dips in the future.
On needs to improve their brand presence on Facebook, where they have a lot of unrealized potential. It is home to their second largest following, but has a mere 2% engagement rate. On can work on creating more engaging content that is specific to Facebook to increase their likes, comments, and shares on the platform.
In terms of video content, On performs better on YouTube than they do TikTok. Despite the current situation around the TikTok ban in the US, On should reevaluate the type of video content they make on the TikTok platform. The brand has the opportunity to reach younger audiences on the platform, and not doing so would be a missed opportunity.
References
Blanchard, O. (2011). Social Media ROI. Pearson Education.
History of On Running & On Cloud Shoes. (2023, June 23). JD Sports US. https://blog.jdsports.com/history-of-on-running-on-cloud-shoes/
https://www.on.com/en-us/. (n.d.). On. https://www.on.com/en-us/
Newcomb, T. (2021, September 15). On’s IPO Is A “Starting Line” For The Fastest-Growing Athletic Shoe Brand In U.S. Forbes. https://www.forbes.com/sites/timnewcomb/2021/09/15/ons-ipo-launch-a-starting-line-for-fastest-growing-athletic-shoe-brand-in-us/?sh=477e0711172f
Thony, S. L. (2024). The Marketing Campaign Playbook. STK MKT Entertainment.
West, C. (2023). 19 Social Media Metrics That Really Matter—And How to Track Them. Hootsuite. https://blog.hootsuite.com/social-media-metrics/

Leave a comment